View Intelligence Layer

View AI
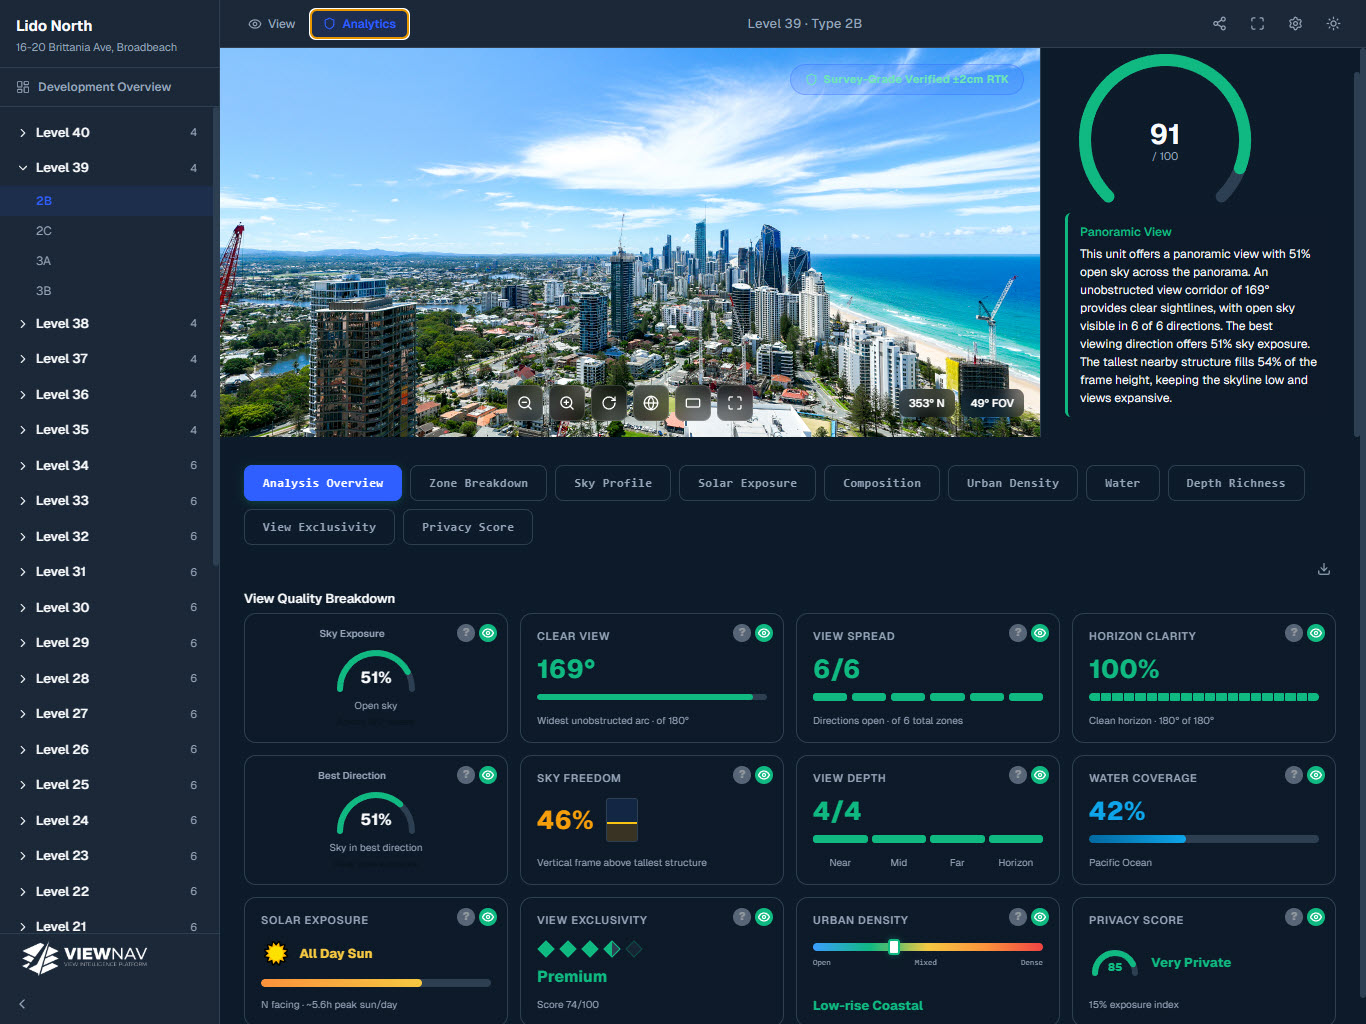
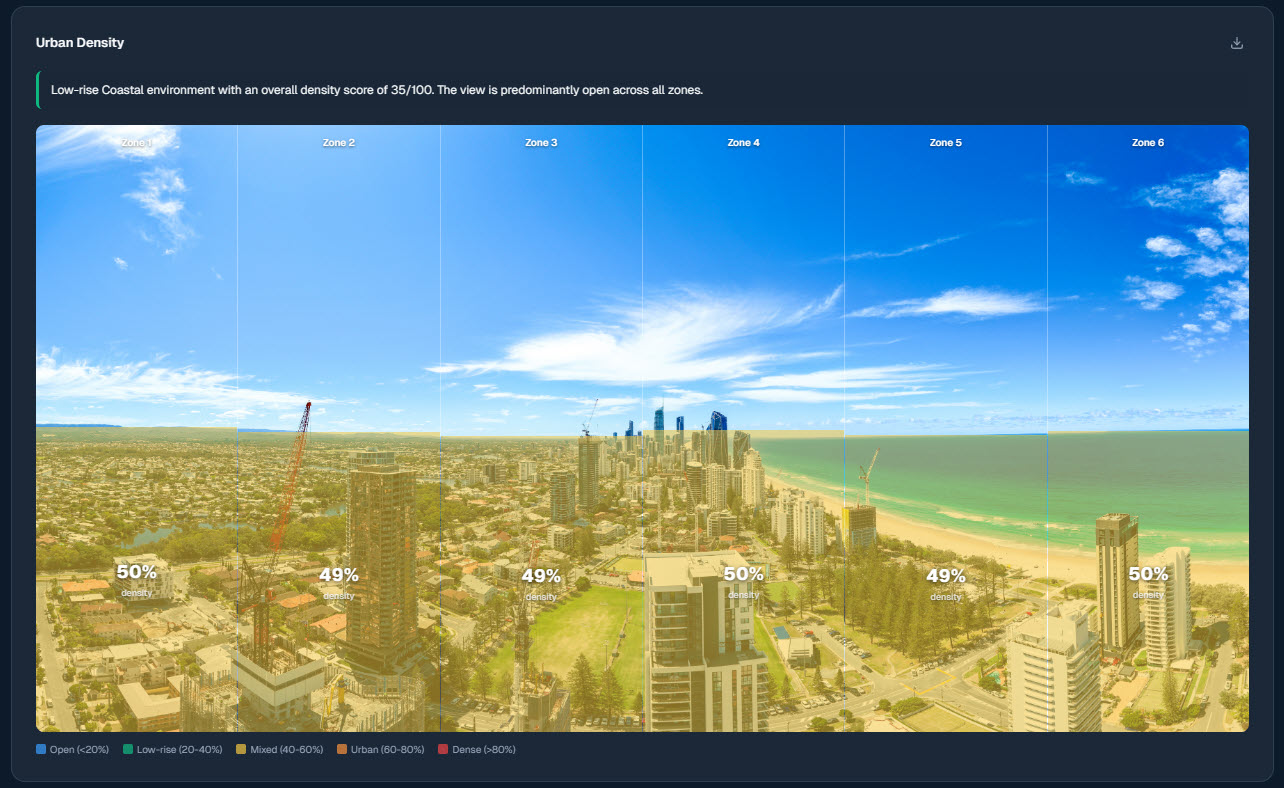
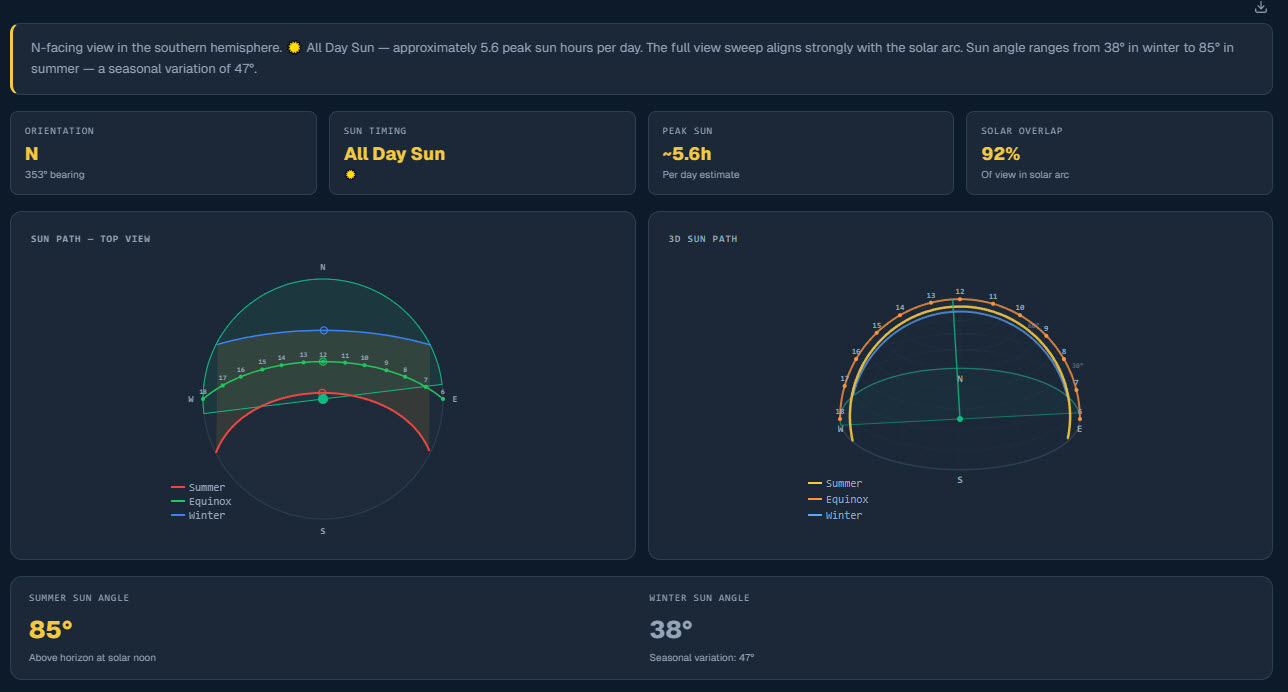
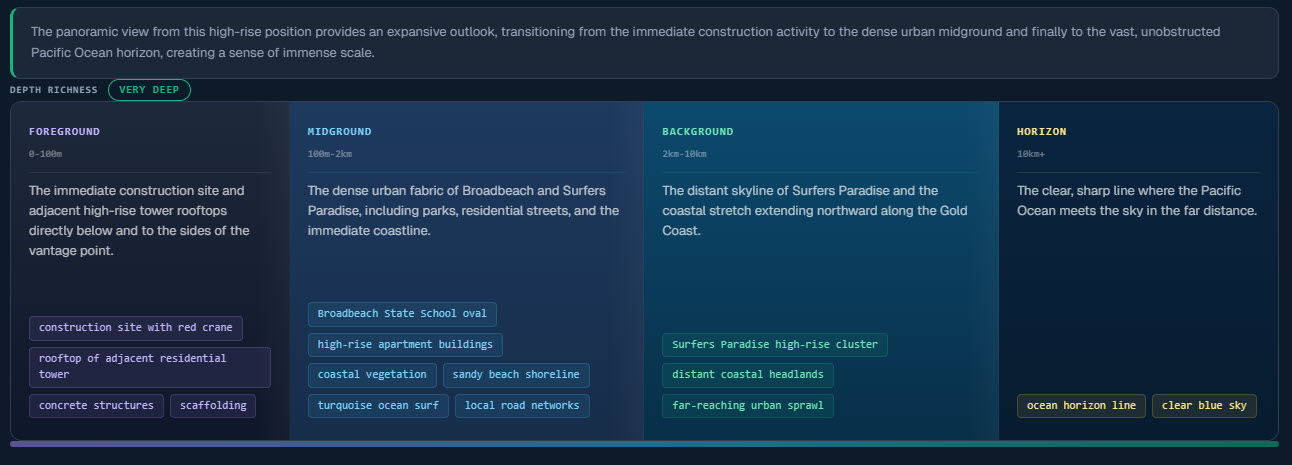
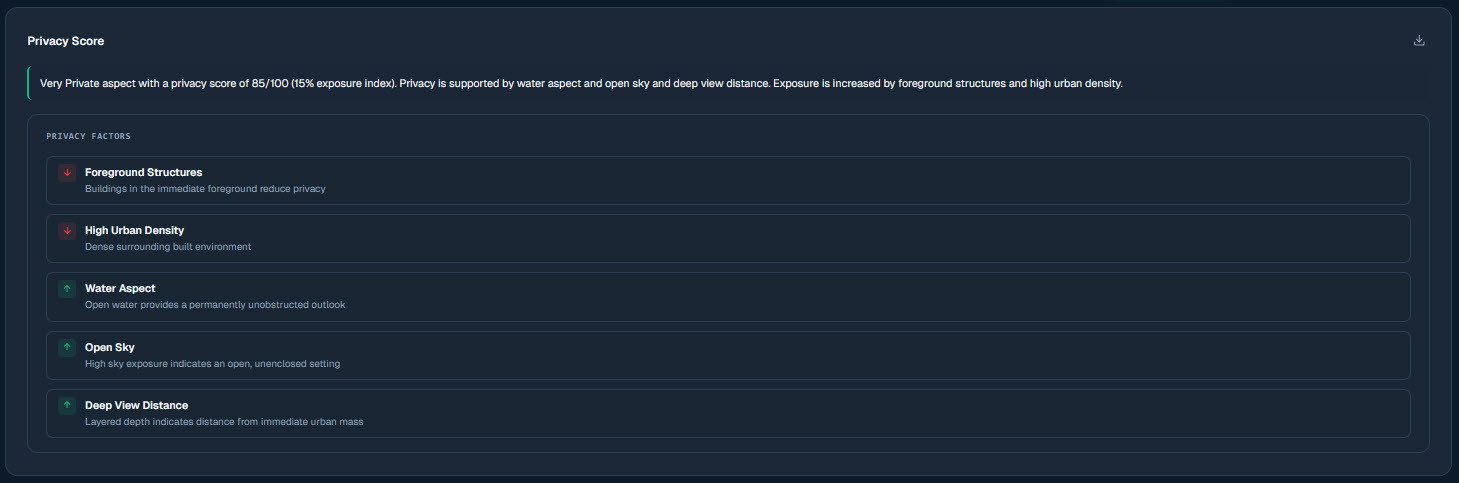
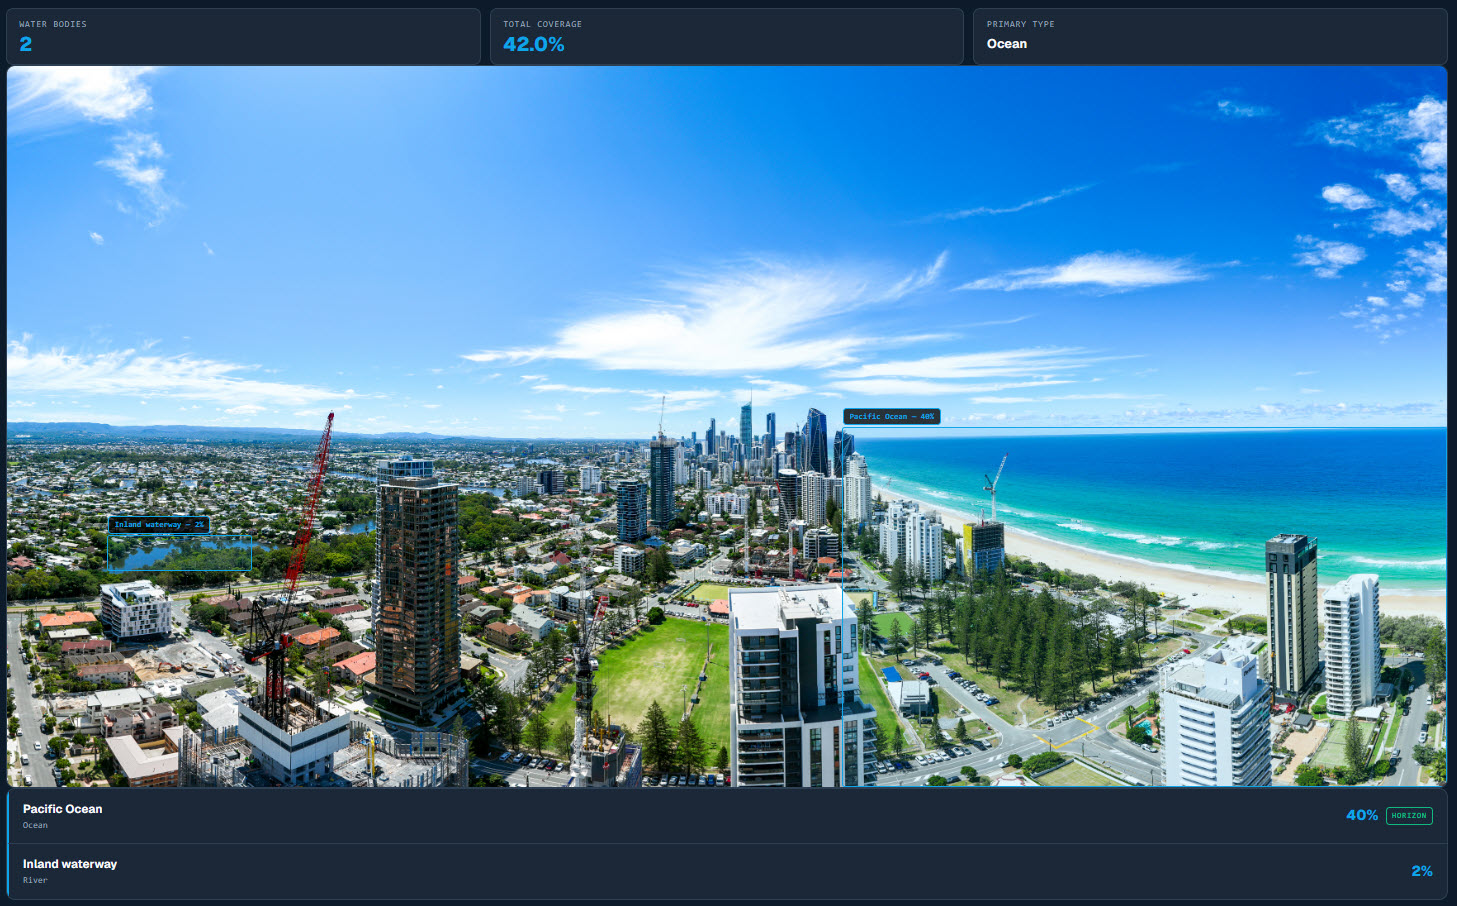
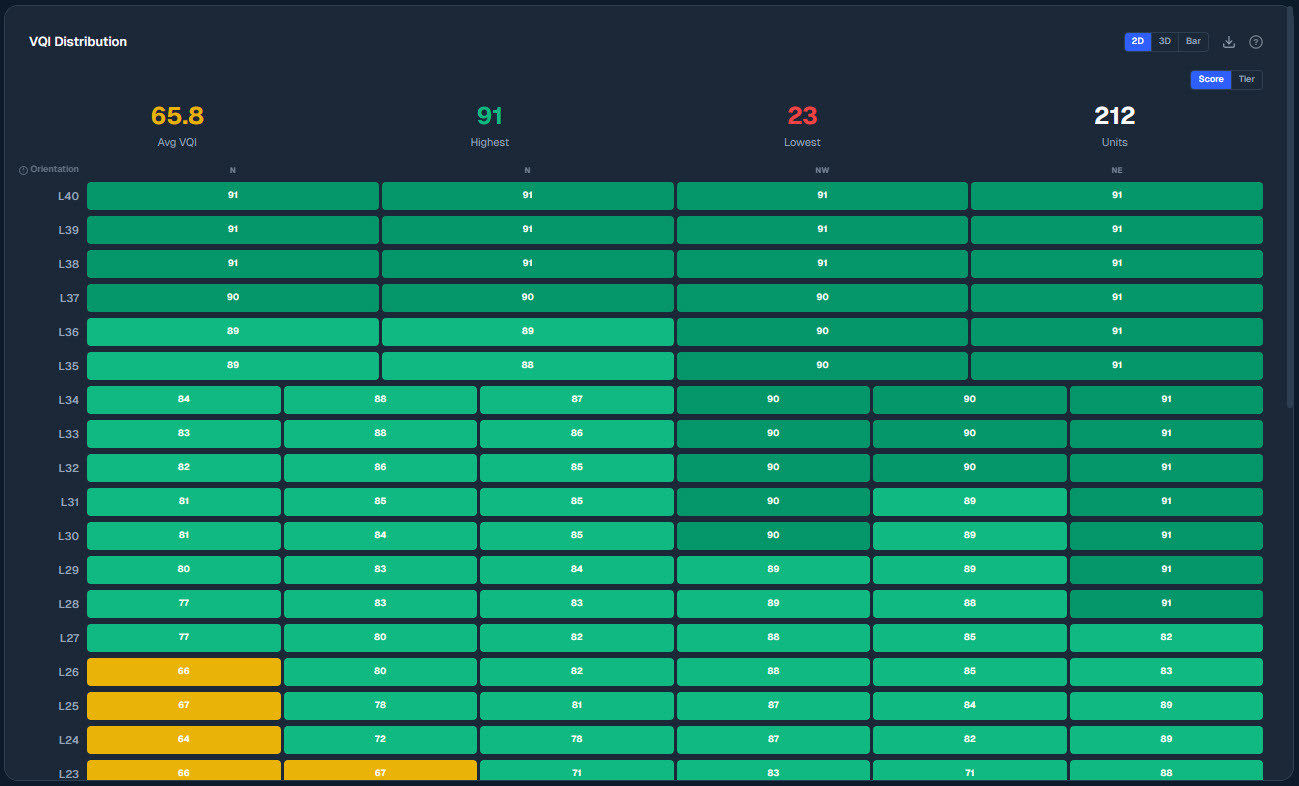
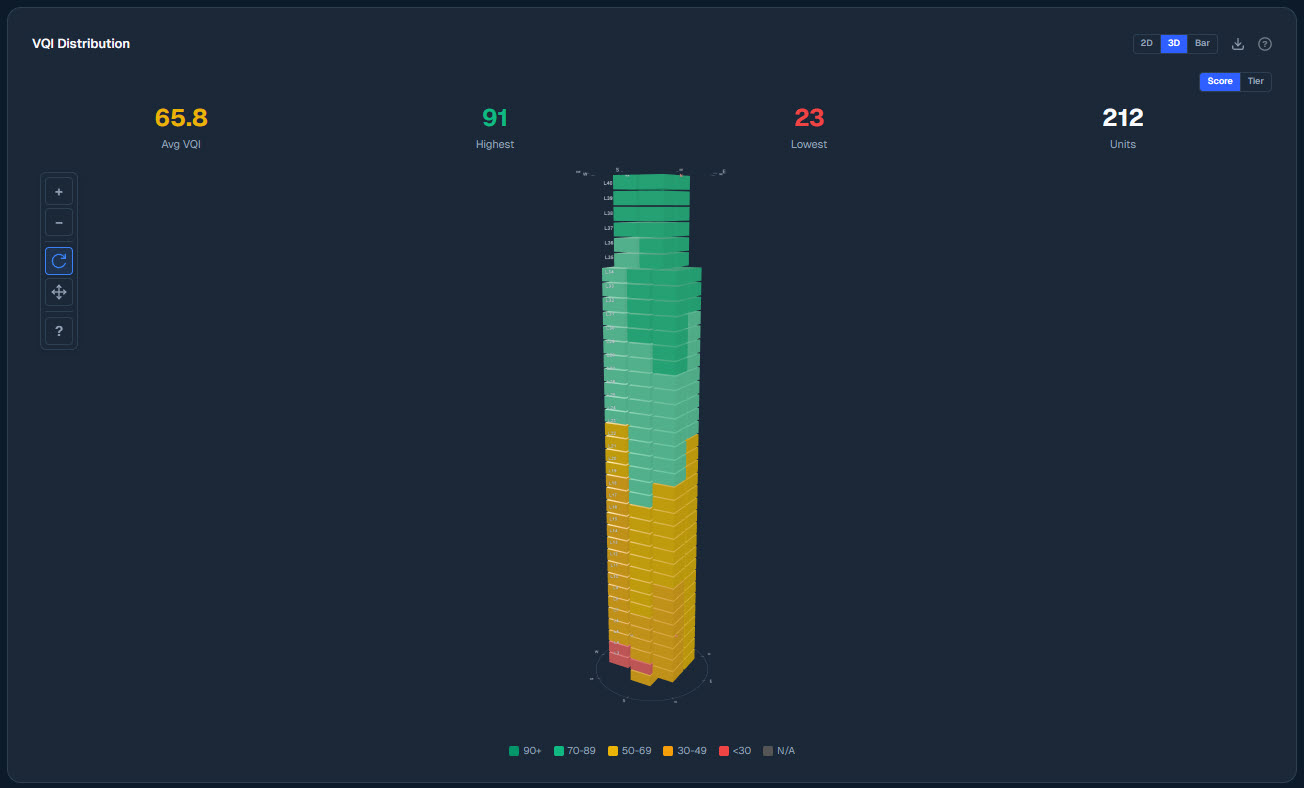
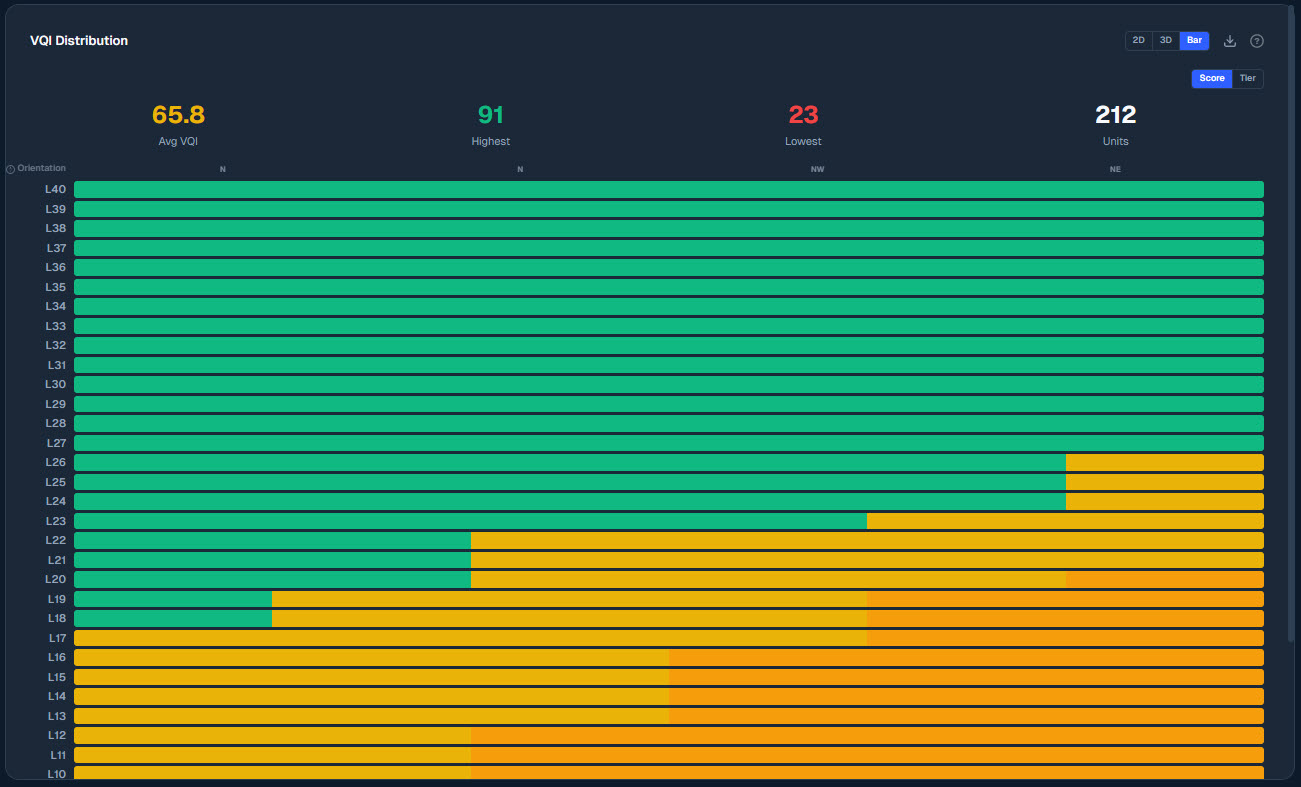
Every view. Quantified.

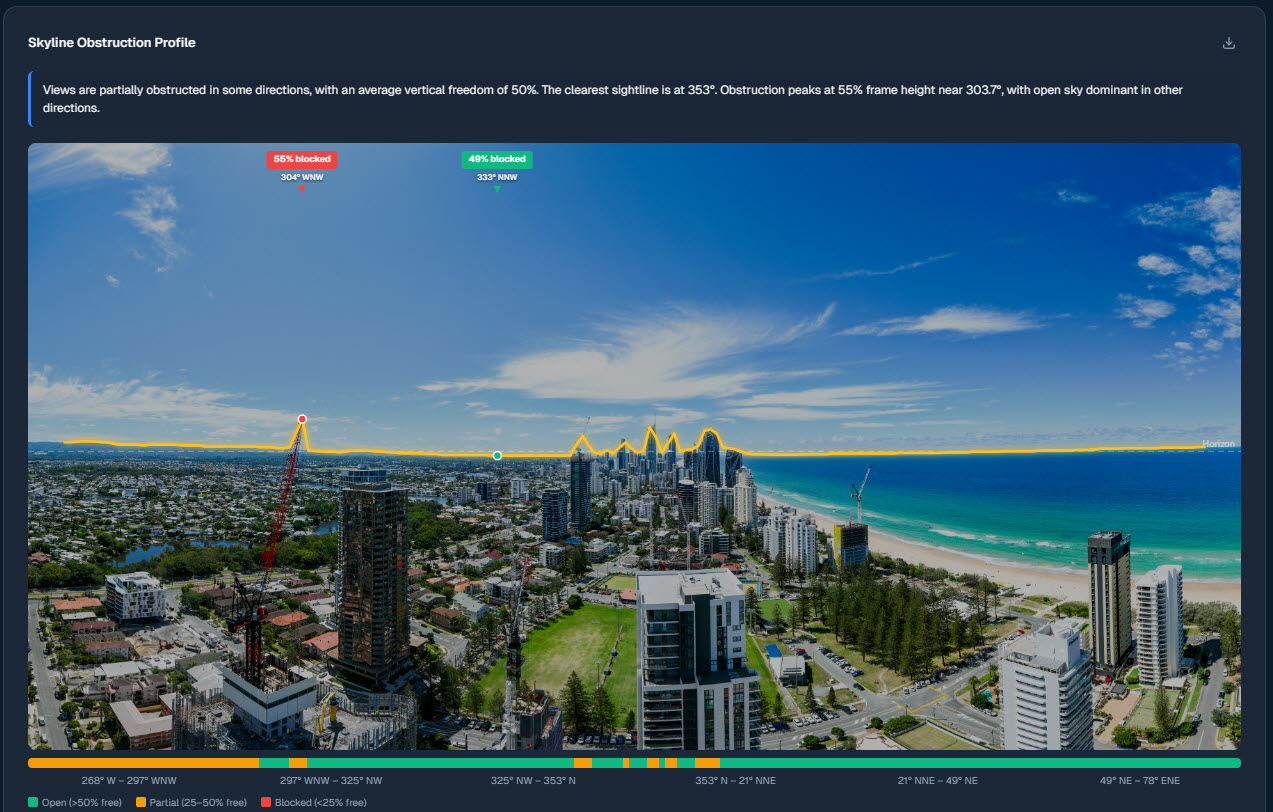
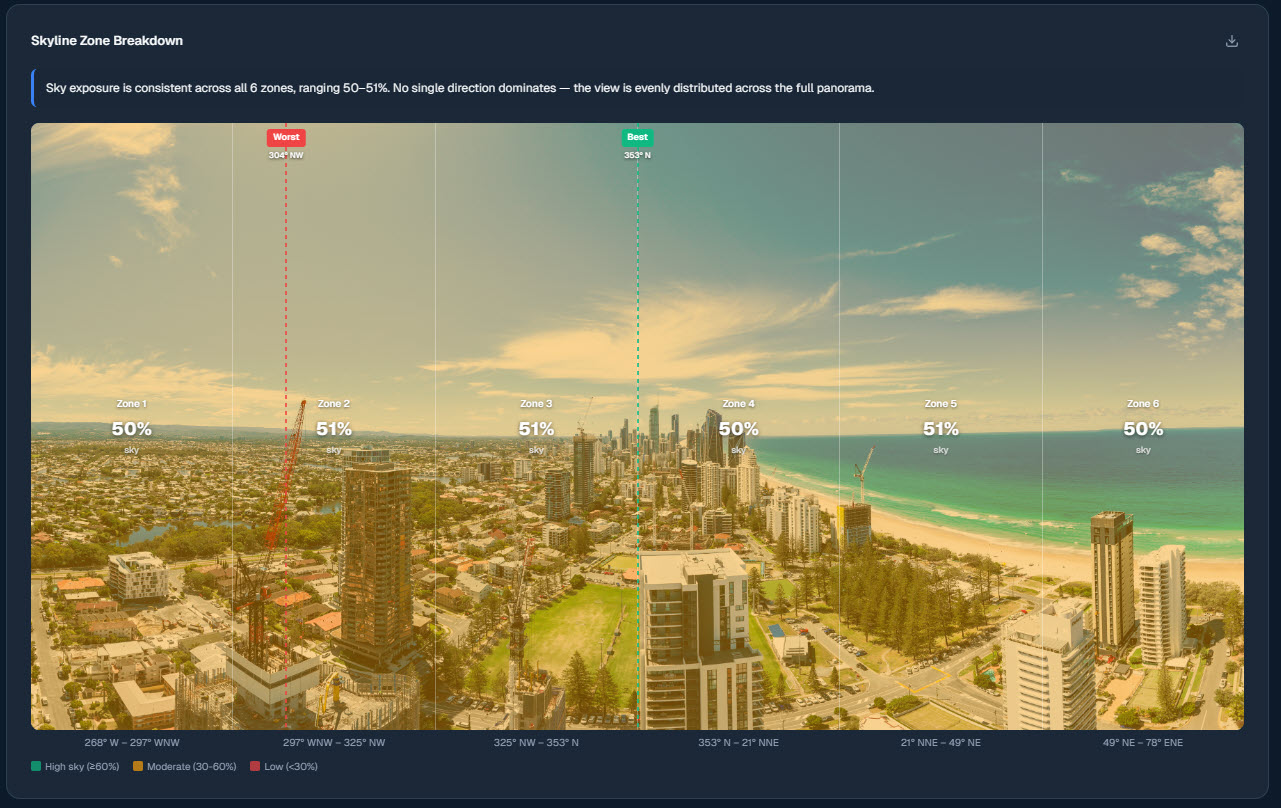
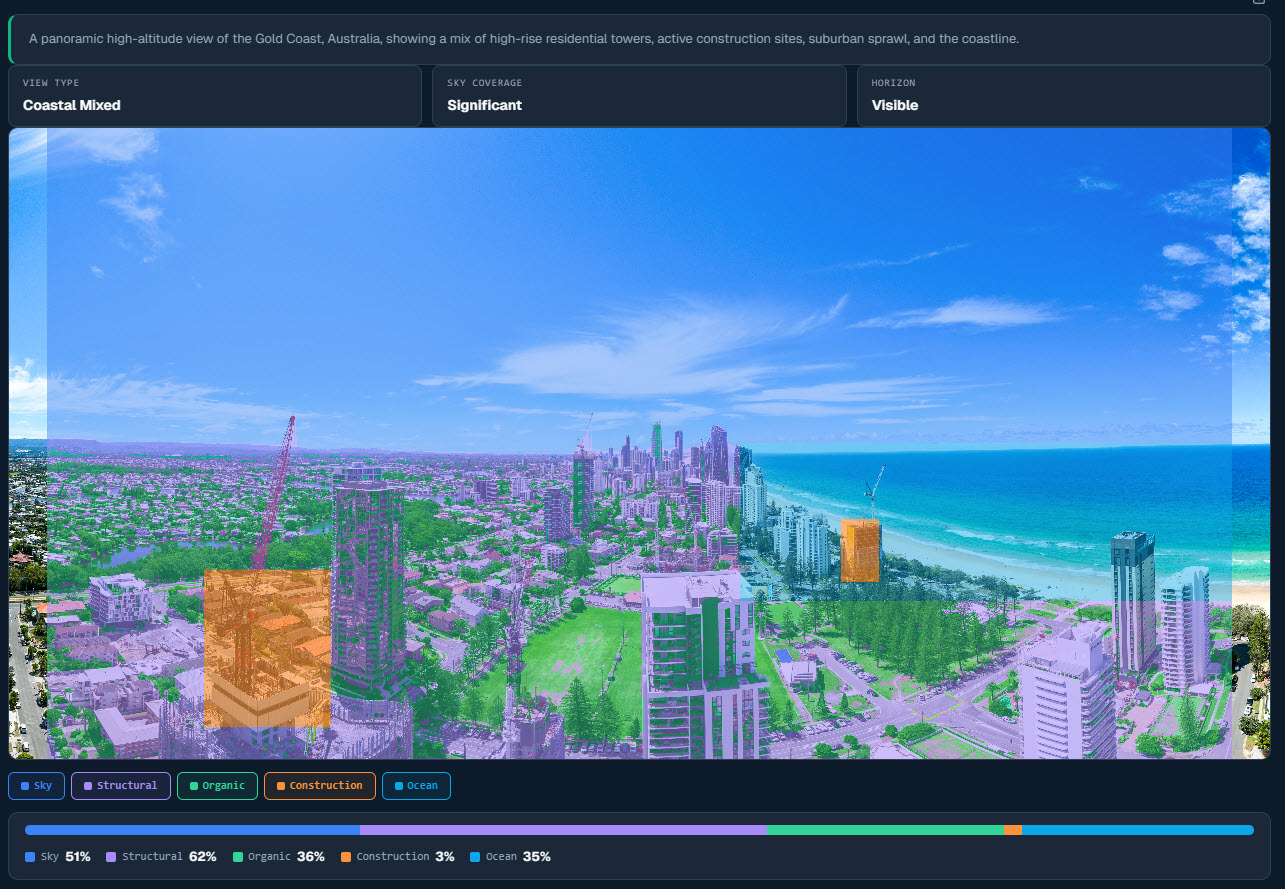
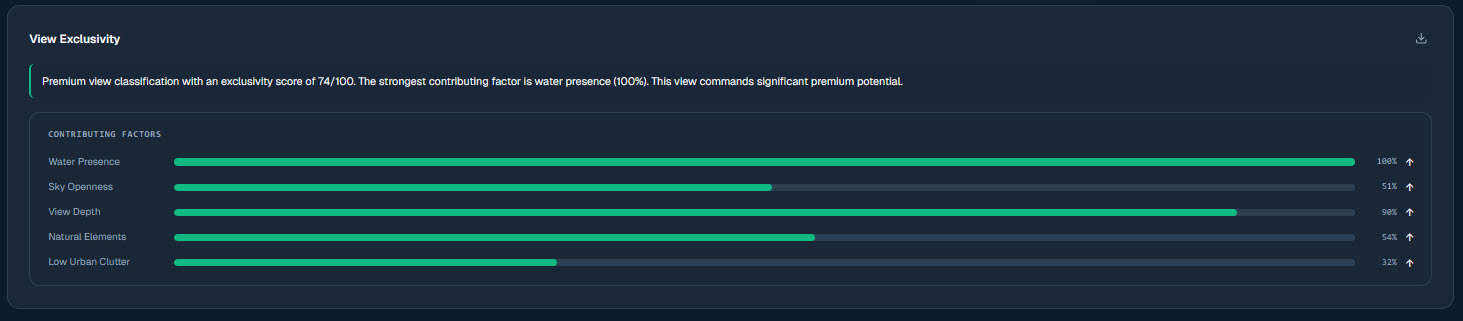
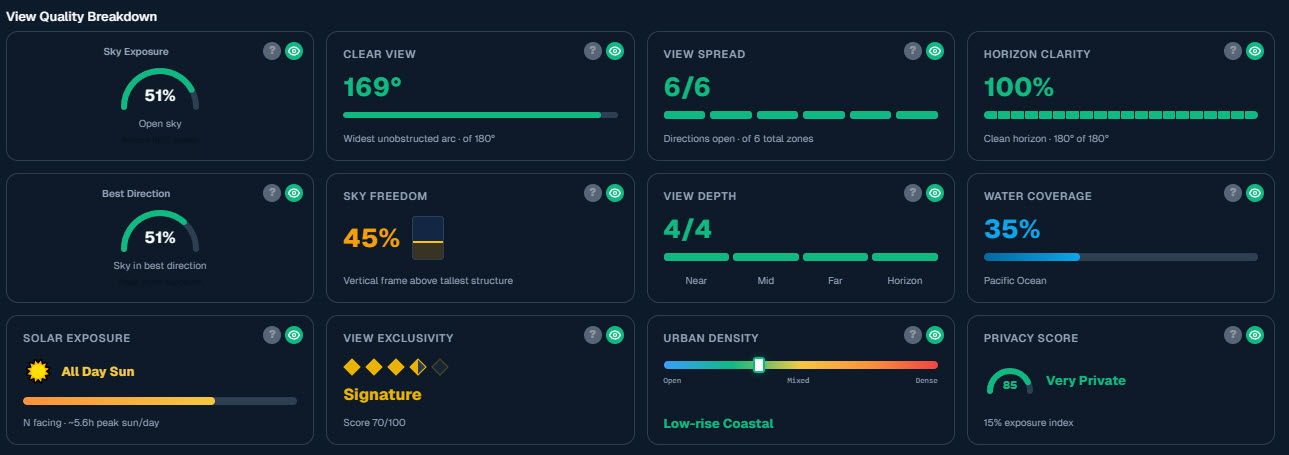
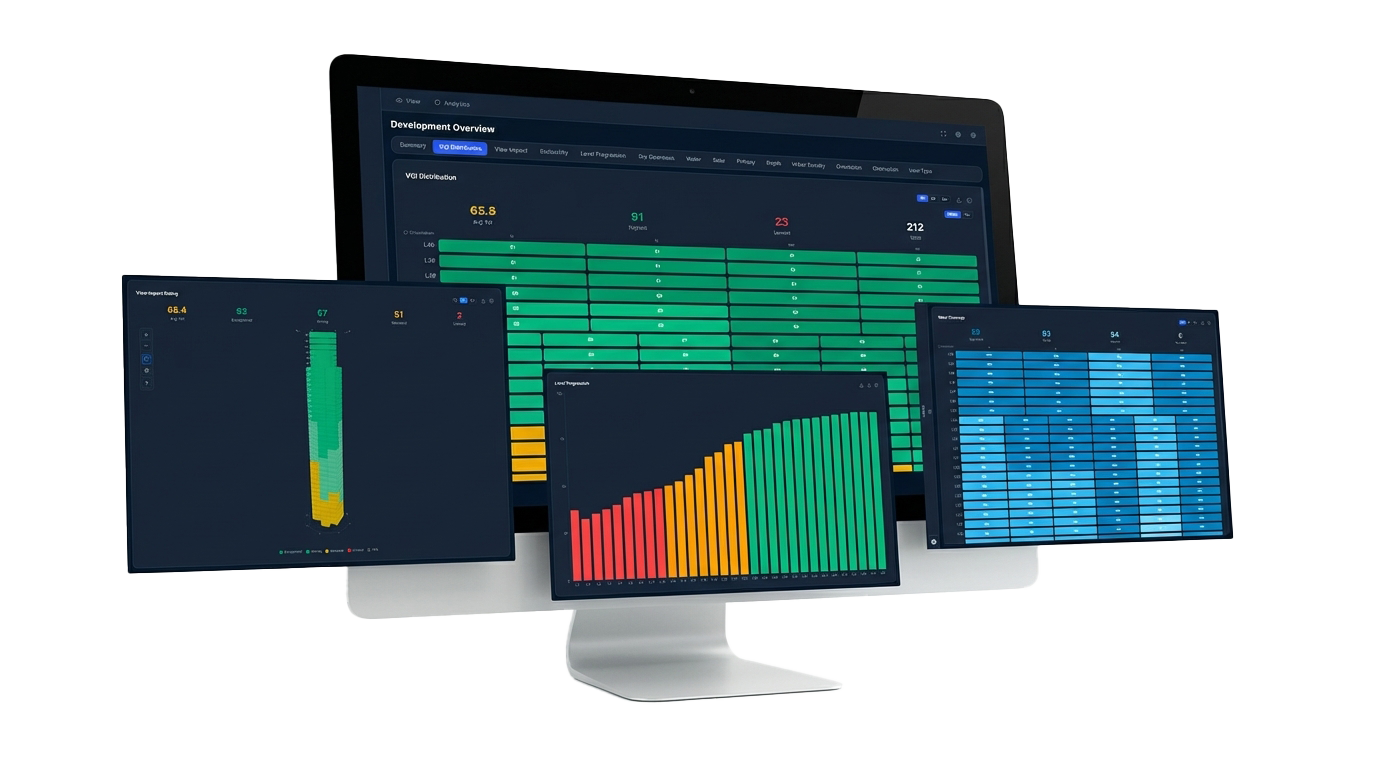
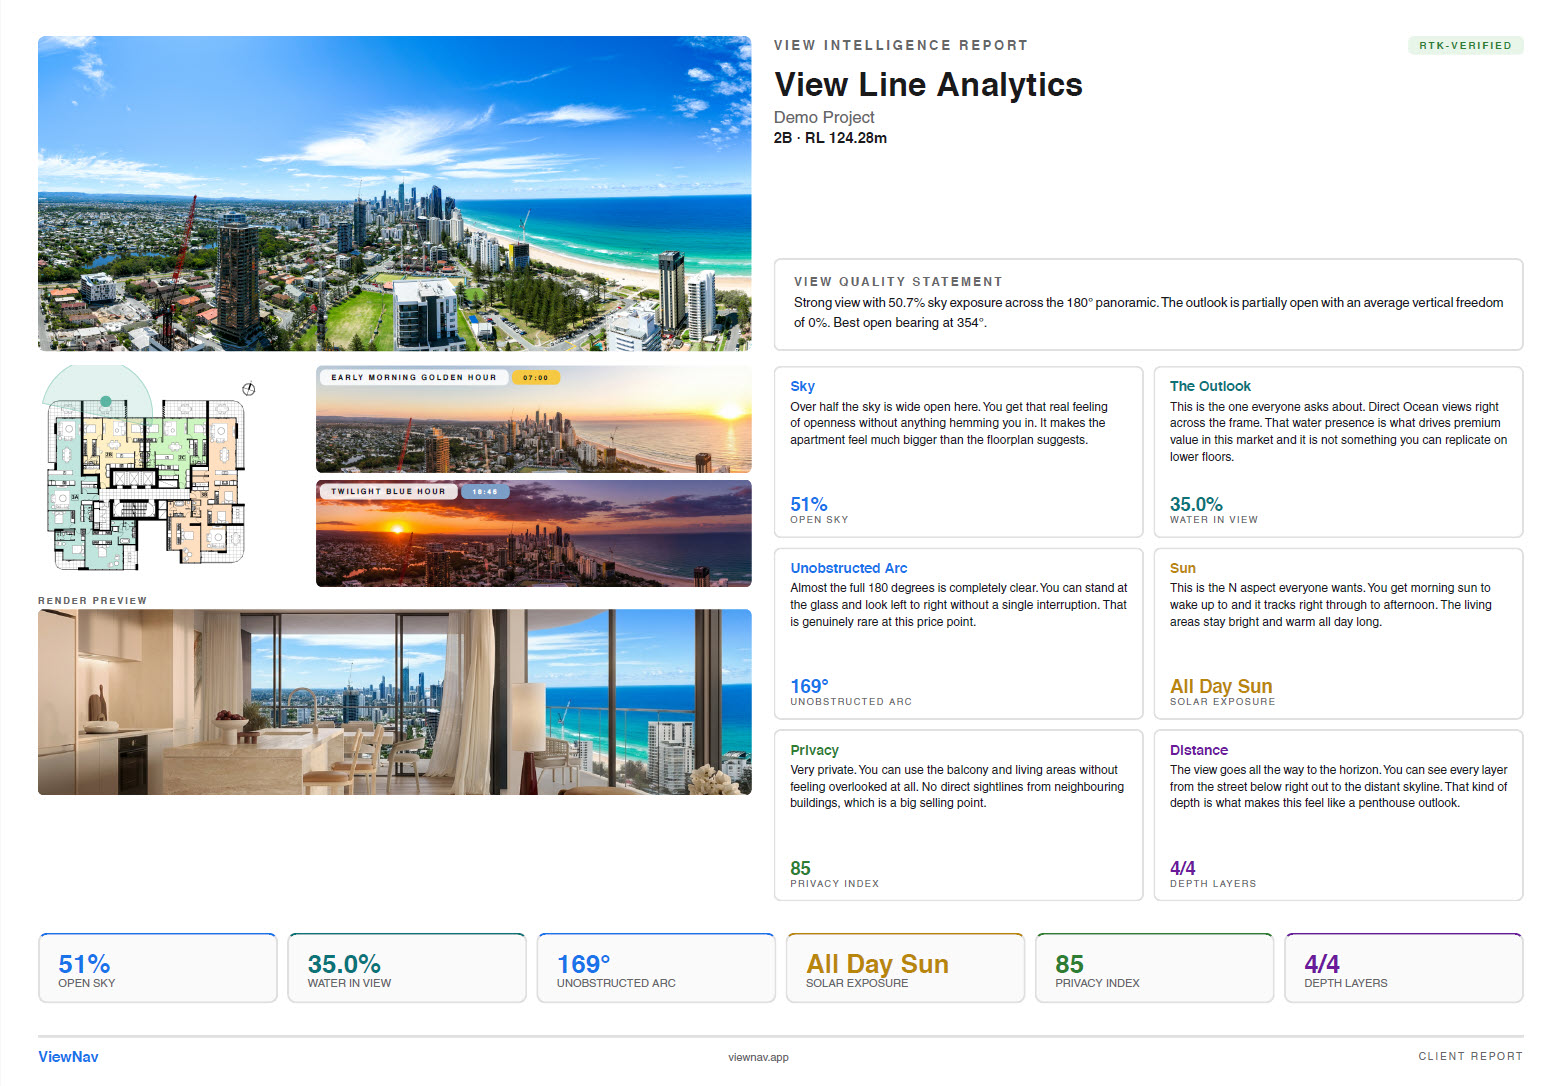
AI-powered analytics that turn captured panoramas into 10 scored dimensions of view quality — giving developers verified numbers to price, present, and defend view premiums.

82
VQI
Sky Exposure
74%
Solar Access
88%
Water View
62%
Privacy Score
91%
View Depth
79%
VQI Score per unit
10 analytics dimensions
PDF export included
Scout AI included
app.viewnav.app / your-site / development-overview
Development Overview dashboard
Who it's for

Analytics that answer real questions

View AI is built around three specific audiences — each with different questions the data needs to answer.

Property Developer
Price with confidence

Feasibility, floor mix, and pricing strategy informed by verified view data — not assumptions.

Which floors justify a view premium?
Where does view quality jump enough to price-tier?
How does water coverage vary by orientation?
Marketing Agent
Show the data, close the deal

Replace subjective view descriptions with verified numbers your sales team can stand behind in any conversation.

What makes this unit's view premium-grade?
How does Level 28 compare to Level 22?
Can we export a client report for this buyer?
Design & Planning
Validate at the earliest stage

Understand how orientations, setbacks, and neighbouring developments will affect view quality before construction is complete.

Which orientations are most exposed to obstruction?
Does a neighbouring building impact solar access?
What's the privacy risk from the adjacent tower?
Analytics Depth

Nine ways to see the view

Each analytics tab delivers a distinct dimension of view quality — all overlaid directly on the actual panoramic so data is always in context.

Skyline Profile analytics overlay
Tab 01 of 09

Skyline Profile

A yellow trace drawn across the panoramic marks exactly where the skyline sits. Peaks show where buildings rise above the horizon; valleys show where open sky breaks through. Gives an instant read on how much sky is blocked and where obstructions are worst.

Sky blocked · Best bearing · Worst bearing
Zone Breakdown analytics overlay
Tab 02 of 09

Zone Breakdown

The 180° panoramic is divided into six equal zones, each with its own sky exposure percentage. Reveals which compass directions have the most open sky and which are hemmed in — instantly showing the view's strengths and weak spots.

6 zones · % sky per zone · Obstruction by direction
Composition analytics overlay
Tab 03 of 09

Composition

Every pixel is classified into categories — sky, structural (buildings), organic (trees), construction (cranes), and water. A colour-coded overlay shows what the view is actually made of, with percentages for each element.

Sky · Structural · Organic · Water · Construction
Urban Density analytics overlay
Tab 04 of 09

Urban Density

A heatmap overlaid on the panoramic highlights areas of high built-environment concentration. Red and orange indicate dense clusters of buildings; cooler tones show open space. Tells you how urban or spacious the outlook feels.

Density score · Open vs enclosed · Built % per zone
Solar Exposure analytics overlay
Tab 05 of 09

Solar Exposure

The sun's daily arc is plotted over the panoramic, showing exactly when and where direct sunlight reaches the unit. Morning, midday, and afternoon positions are mapped against the skyline.

Sun arc · Peak hours · Morning / Afternoon access
Depth Richness analytics overlay
Tab 06 of 09

Depth Richness

The view is segmented into distance layers — foreground, midground, background, and horizon. Colour-coded bands show how much visual depth the outlook contains.

4 depth layers · Visual richness score
Privacy Score analytics overlay
Tab 07 of 09

Privacy Score

Neighbouring buildings are assessed for proximity, height, and window density. The overlay highlights which directions carry overlooking risk.

Privacy classification · Overlooking risk · Direction score
Water Coverage analytics overlay
Tab 08 of 09

Water Coverage

AI detection identifies all visible water bodies and highlights them on the panoramic. Total water coverage percentage shows how much of the view includes water — one of the most sought-after features in residential property.

Water % · Body type · Coverage by zone
View Exclusivity analytics overlay
Tab 09 of 09

View Exclusivity

Each unit's VQI is compared against every other unit in the development and classified into tiers — Premium, Signature, Standard, or Common.

Premium · Signature · Standard · Common
View Quality Index

One number that captures everything

VQI is a composite score from 0–100 that synthesises all analytics dimensions into a single defensible number for each unit.

A score developers can defend in any pricing conversation

VQI isn't a subjective rating — it's a composite of ten measured dimensions, each weighted by its contribution to overall view quality. A unit scoring 85 can be compared directly to any other unit in the development, or to units in a comparable project.

Premium80–100Exceptional, irreplaceable views — top-tier pricing
Signature60–79Strong, distinctive views — mid-premium pricing
Standard40–59Good views — standard market pricing
Common0–39Limited views — no view premium applicable
Unit 3802 · Level 38 · NE Aspect
Sky
74%
Solar
88%
Water
62%
Privacy
91%
Depth
79%
Density
68%
Composite VQI Score
82
Signature · Top 22% of this development
View Quality Breakdown

12 KPI cards per unit

Every unit receives a full View Quality Breakdown — 12 individual KPI cards covering every dimension from sky openness to privacy score. Each card delivers a single metric with explanation, making the data legible for buyers and precise enough for developers.

View Quality Breakdown — 12 KPI cards
KPI 01
Sky Exposure

How much open sky is visible. Higher percentage means more natural light, an open feel, and fewer obstructions above the horizon.

KPI 02
Clear View

The proportion of the panoramic that is completely unobstructed — no buildings, cranes, or structures blocking the line of sight.

KPI 03
View Spread

How wide the unobstructed view extends across the horizon in degrees. A wider spread means the open view isn't confined to a narrow gap between buildings.

KPI 04
Horizon Clarity

How clearly the distant horizon line is visible without interruption. A clean, continuous horizon suggests long-range views with minimal near-field blockage.

KPI 05
Best Direction

The compass bearing with the highest view quality score — tells you exactly which way to face for the most impressive, unobstructed outlook.

KPI 06
Sky Freedom

How free the overhead view is from encroaching structures. Even with a good horizon view, tall nearby buildings can close in the sky above.

KPI 07
View Depth

How far into the distance you can see — from foreground to midground to deep background. Greater depth means more visual layers and a more expansive feel.

KPI 08
Water Coverage

The percentage of the view containing visible water — ocean, river, harbour, or lake. Consistently among the highest-value features in residential property.

KPI 09
Solar Exposure

How much direct and ambient sunlight reaches the unit throughout the day, factored from the sun's path relative to the view direction.

KPI 10
View Exclusivity

How rare and premium the view is compared to all other units — rated Premium, Signature, Standard, or Common based on overall VQI relative to the development.

KPI 11
Urban Density

How much built environment fills the view frame. Lower density means more natural or open space; higher indicates a more urban, enclosed outlook.

KPI 12
Privacy Score

How private the unit is from being overlooked. Accounts for proximity, height, and window density of surrounding structures with direct sight lines into the unit.

Development Overview

Every unit. Every floor. One view.

The Development Overview gives principals a complete picture of view quality distribution across all units — essential for pricing strategy and floor mix decisions.

Development Overview Dashboard
01
VQI Distribution

A 2D heatmap grid showing the View Quality Index for every unit on every floor, colour-coded from green (high) to orange (low). Scan the entire building at once and spot clusters of strong or weak views.

02
View Impact (3D)

A rotatable 3D building model where each unit is colour-coded by its View Impact Rating. Spin to see how view quality wraps around the tower and changes with height.

03
Exclusivity Tiers

Every unit classified into Premium, Signature, Standard, or Common tiers based on VQI score relative to the development — showing exactly how many units fall into each pricing band.

04
Level Progression

Average VQI per floor from ground to top, colour-coded by tier. Reveals the exact floor where premium views begin and where the biggest score jumps occur.

05
Water Coverage Map

Percentage of water visible from every unit, shaded from deep blue (significant) to light (none). Identifies which orientations and floors capture the most sought-after water views.

06
Unit Comparison Table

A sortable, filterable table listing every unit with key metrics side by side — VQI, sky, obstruction, water, depth, solar, density, and privacy. The fastest way to compare any two units.

Three Ways to View

Every metric, three chart types

Every metric, three chart types

Each development overview panel can be viewed as a 2D heatmap, an interactive 3D building model, or a horizontal bar chart — switch between them with one click.

2D Heatmap
Grid layout — every unit by floor and orientation, colour-coded at a glance
3D Building Model
Rotatable tower — see how scores wrap around faces and change with height
Bar Chart
Floor-by-floor bars — quickly compare orientations within the same level
2D Heatmap view
Every unit on every floor laid out in a grid, organised by orientation (columns) and level (rows). Each cell colour-coded by score — green for high, yellow for mid-range, orange for low. Spot clusters of strong or weak views at a glance.
3D Building Model view
A rotatable three-dimensional model of the tower where each unit is colour-coded by the selected metric. Spin, zoom, and pan to see how scores change with height and wrap around the building's faces.
Bar Chart view
Horizontal bars show the score for every unit grouped by floor. Bar length and colour instantly reveal which units outperform — especially useful for identifying the exact floor where scores jump and the pricing tier boundary.
PDF Export

Two reports. Two audiences.

View AI generates two distinct PDF exports — a client-facing report for buyers and a developer analytics report for principals, pricing strategy, and feasibility.

Client Report
Buyer-facing. Plain-English view summary, KPI highlights, panoramic image, and RTK verification badge. Designed to hand to a buyer during or after an inspection.
Developer Analytics
Developer-facing. Full 12 KPI breakdown, VQI score, development comparison, floor differential, and view exclusivity tier. Designed for pricing decisions and board presentations.
ViewNav Client Report
Scout AI

Ask anything about your development

Scout AI is a natural language query panel built into View AI. Type a plain English question about your project and it interrogates the full unit dataset to find and highlight matching units.

Query units by any combination of metrics
Matching units highlighted in the viewer automatically
Top match panoramic loaded instantly
Dynamic suggested queries from your actual project data
Non-matching units dimmed, not hidden
Scout AI · Your Project
Show me units above level 20 with good water views and privacy score over 80
Found 14 units matching — levels 22–38, north and north-east facing. Best match: Unit 3802 (VQI 82, 62% water, privacy 91). I've loaded it in the viewer and highlighted all 14 matches on the floor plan.
Which level has the biggest VQI jump?
The biggest jump is between Level 20 and Level 22 — average VQI goes from 58 to 74. That's where the Broadwater horizon clears the adjacent tower to the north-east.
Best morning sunHighest water coverageMost private unitsPremium tier units
Add View AI

Your views have value. Now prove it.

View AI is added to any ViewNav project as a flat one-time fee — no subscription, no lock-in. Tell us about your development and we'll include it in your proposal.

Email *
Project name
Project address
Levels 10
Units 50
Interested in
Please enter a valid email address.

Fixed-price · No lock-in · Response within 1 business day

Proposal request received — we'll be in touch within 1 business day.